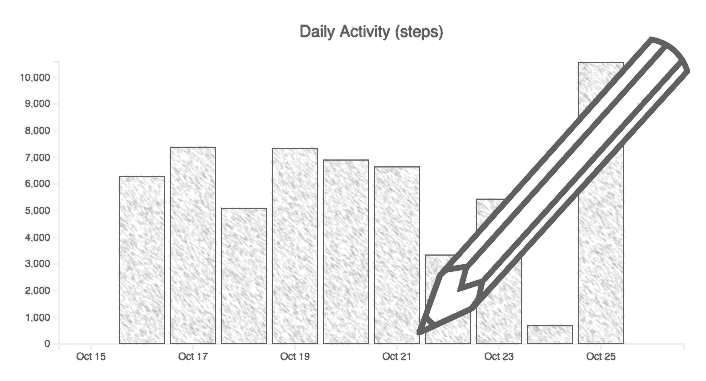
Customizing Charts
Deprecated feature
The current iteration of the Chart API will continue to be available for paying customers but will not be actively developed. Thank you for your understanding.

Once you have added a chart to your page, customizing charts from the Chart API can be easily done via query parameters added to the iframe URL. The guide below will outline all available options, chart types, and styling tips.
See the Chart API Overview for more information on authenticating and adding a chart to your page.
Query Parameters
There are numerous query parameters that you can use to customize the aesthetic and data for each graph. Chart API parameters universal to all chart types are listed in this section and all other non-universal parameters are listed along with each chart's description in subsequent sections of this page.
Standard Query Parameters
All standard query parameters used for the Data API are also valid when rendering charts. Please refer to the standard query parameters (including date ranges) as detailed on the Patterns and Conventions page of the documentation.
| Parameter | Value | Description |
|---|---|---|
chart_token | Chart Token | [Required] Chart Token for the relevant Human API user. (See Chart API Overview for information on obtaining a chart token) |
y | Data Parameter | The value that you would like plotted on the graph as it relates to the Human API JSON data object. See the API Reference for each data type. (e.g. "steps", "calories", "duration", etc...) Note: must be a numerical value |
days | Number of days ( max 50 ) | Returns a graph with data for the specified number of days ending with the current day. This calculates start_time and end_time date range parameters, which can alternatively be supplied explicitly for an end date that is not the current day |
color | Hex or CSS Color (omit # for hex) | Add a custom color theme to your graph. (e.g. "lightgreen" and "90EE90" are equivalent) Defaults to "steelblue" if not specified. |
unit | Unit for plotted Y Value | Time = [milliseconds, seconds, minutes, hours]Distance = [ millimeters, centimeters,meters,kilometers, inches, feet, miles]Mass = [ kilograms, lbs]Retains default object value if not specified |
Max Records Displayed
By default, all charts will display a maximum of 50 records. To display up to 500, ensure you set a higher
limitparameter.
External Styling
When placing a chart on your page, there are only three external formatting items that need to be defined: border, width & height.
We recommend setting border: none so that the chart appears like a native part of your application. Additionally, all charts are dynamically sized based on the defined height and width of the iframe, so it is important to set these properties as well.
A basic implementation of the CSS styling properties might look like this:
iframe {
  border: none;
  width: 100%;
  height: 300px;
}
Chart Types
Below are all possible chart types with examples. For your reference, here are the data types available for the Chart API:
- Periodic Resources = activities, sleeps
- Discrete Resources = blood_glucose, blood_pressure, bmi, body_fat, heart_rate, height, weight
- No Chart = genetics, food, locations
Bar Chart
/v1/human/activities/summaries?chart_token=demo&color=lightgreen&start_date=2015-09-01&end_date=2015-09-28&type=bar&y=distance
Available For:
- Periodic Resources
- Discrete Resources
Summary
Shows a bar graph with detail tooltip on hover.
Periodic & Discrete Resources
Append type=bar query parameter to any endpoint.
Additional Parameters
| Parameter | Value | Description |
|---|---|---|
type | Chart Type | Set to bar to render bar graph. Defaults to line graph. |
Line Graph
/v1/human/blood_pressure/readings?chart_token=demo&color=tomato
Available For:
- Periodic Resources
- Discrete Resources
Summary
Shows a line graph with details and data points on hover.
Periodic Resources
Use any Periodic Resource endpoint.
Discrete Resources
Use any Discrete Resource endpoint with /readings.
Additional Parameters
| Parameter | Value | Description |
|---|---|---|
smoothing | Smoothing Method | Apply a line smoothing method to your graph. Possible values : [ linear, monotone, cardinal, basis](no smoothing <-> high smoothing) Note: basis does not show data point and detail text on hover |
Latest Value
/v1/human/blood_pressure?chart_token=demo&color=lightblue
Available For:
- Discrete Resources
Summary
Shows the latest value retrieved for a particular data type along with the source and time elapsed.
Discrete Resources
Use any query for a discrete resource without /readings
Goal Gauge
/v1/human/activities/summaries?chart_token=demo&color=orange&type=gauge&goal=12000&start_date=2015-10-25&end_date=2015-10-25
Available For:
- Periodic Resources
Summary
Shows a gauge representing how close the user is to a specific goal. (percentage shown on hover)
Use any query for a discrete or periodic resource and set type=gauge and the goal parameter.
For today's totals, simply use days=1
| Parameter | Value | Description |
|---|---|---|
goal | Integer | The goal value represented as the 100% mark of the gauge. |
Chart API Explorer
Updated over 7 years ago
